Data visualisation specialist Tableau, the company co-founded by animation studio Pixar’s chief architect Pat Hanrahan, has picked up Woolworths as a customer, in a rare acknowledgement by the retail giant over what tech vendors it is using.
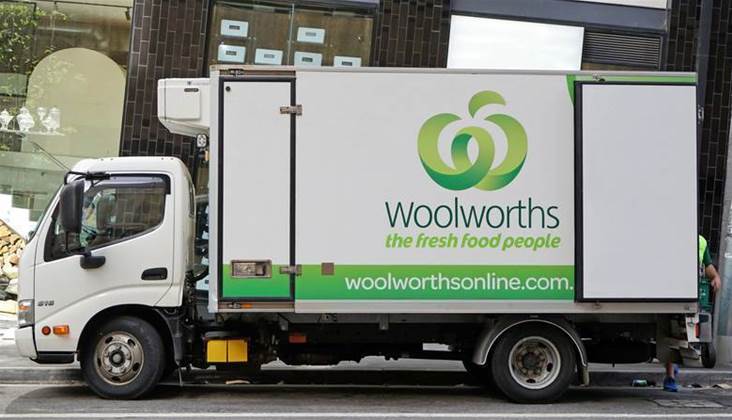
A statement issued by Tableau on Wednesday said Woolworths will “rollout Tableau in a staged deployment in the coming months across multiple group businesses covering functions including merchandising, finance, supply chain, store operations and people operations.”
The deal, the value of which was not disclosed, is notable because it indicates large Australian enterprises are starting to lean towards commercial off the shelf software for analytics and what are termed ‘visuals’ rather than trying to bake their own.
The use of data ‘visuals’ (or visualisation) has become somewhat of a senior corporate imperative over the last 18 months as boards and executive committees bitten by the transformation bug look to demonstrate their strategies and ideas using data in pictures rather than clunky spreadsheets.
Doug Frank, Woolworths’ group general manager of data & analytics is clearly a fan.
“Customer expectations are always rising in retail and we need to work smart to keep up with them. The key advantage of Tableau is speed and ease for our team,” Frank said.
“It will allow team members across the business to analyse, understand and act on customer insights incredibly quickly. We see this type of capability as key to delivering what our customers want and expect of us into the future.”
Mapping and geospatial overlays have become increasingly important to supermarkets who now routinely blend demographic and population information to optimise both the locations and stock of new and existing stores.
Shifting population density and cultural trends are especially pertinent to Woolworths which, like Coles, is trying to minimise margin erosion caused by the growth in online shopping and consumer sentiment shifting to what are perceived to be ‘local’ brands in once lucrative categories like liquor.
At Woolworths’ most recent interim results announcement management candidly admitted it had been late to the party in spotting a trend away from Champagne and big brand beer to boutique gin and craft brews.
It might sound kooky, but plotting the location of mini and microbreweries and their distribution is exactly the kind of picture a major retailer would use the likes of Tableau for in terms of knowing what to promote in-store and where for outlets like BWS and Dan Murphy’s, both of which are hurting.
Corks will be popping at Tableau though.
“Retailers worldwide are transforming themselves to thrive in the omni-channel marketplace. We're delighted to partner with Woolworths to fuel their innovation agenda through modern business intelligence for the benefit of its customers,” said Nigel Mendonca, Tableau’s Australian head.
Especially delighted, in all likelihood, that the Woolies account went to them, rather than Microsoft.

.jpg&h=140&w=231&c=1&s=0)



.jpeg&h=271&w=480&c=1&s=1)
